Introduction
The Speech Recognition Research Project, a university-sponsored initiative, was developed to study speech recognition in challenging environments with muffled speech or occluded microphones. A critical component of this research involved generating visualizations of audio files to help researchers analyze and understand the acoustic properties of speech under various constraints.
The original system was built in C++, utilizing specialized libraries like libsndfile for audio processing, FFTW for Fast Fourier Transform calculations, and CImg for image generation. While functional, the codebase presented maintenance challenges as most of the development team was more experienced with managed code platforms.
Original C++ Implementation
The C++ implementation leveraged three main libraries to create a pipeline for audio analysis and visualization:
- libsndfile - Handled the loading of mono WAV files into memory
- FFTW - Performed Fast Fourier Transform calculations for frequency analysis
- CImg - Generated visualization images of both time-domain and frequency-domain data
Original C++ Code
#include <string>
#include <vector>
#include <cmath>
#include <stdexcept>
#include <iostream>
#include <sndfile.h>
#include <fftw3.h>
#define cimg_display 0
#include "CImg.h"

class AudioVisualizer {
public:
    bool loadAudioFile(const std::string &filename) {
        SF_INFO sfInfo;
        sfInfo.format = 0;
        SNDFILE *file = sf_open(filename.c_str(), SFM_READ, &sfInfo);
        if (!file) return false;
        if (sfInfo.channels != 1) {
            sf_close(file);
            return false;
        }
        audioData.resize(sfInfo.frames);
        sf_read_float(file, audioData.data(), sfInfo.frames);
        sampleRate = sfInfo.samplerate;
        sf_close(file);
        return true;
    }

    void saveWaveformImage(const std::string &outFilename, int width = 800, int height = 200) {
        if (audioData.empty()) throw std::runtime_error("No audio data.");
        cimg_library::CImg<unsigned char> img(width, height, 1, 3, 0);
        float m = 0;
        for (auto &s : audioData) if (std::fabs(s) > m) m = std::fabs(s);
        if (m < 1e-9f) m = 1.f;
        int total = (int)audioData.size();
        double step = (double)total / width;
        int midY = height / 2;
        unsigned char color[3] = {255, 255, 255};
        for (int x = 0; x < width; ++x) {
            int start = (int)(x * step), end = (int)((x+1) * step);
            if (end >= total) end = total - 1;
            double sum = 0;
            for (int i = start; i <= end; ++i) sum += audioData[i];
            double avg = sum / (end - start + 1);
            int amp = (int)((avg / m) * (height / 2 - 1));
            if (amp >= 0) {
                for (int y = midY; y > midY - amp; --y) {
                    img(x,y,0) = color[0]; img(x,y,1) = color[1]; img(x,y,2) = color[2];
                }
            } else {
                for (int y = midY; y < midY - amp; ++y) {
                    img(x,y,0) = color[0]; img(x,y,1) = color[1]; img(x,y,2) = color[2];
                }
            }
        }
        img.save(outFilename.c_str());
    }

    void saveFFTMagnitudeImage(const std::string &outFilename, int width = 800, int height = 200, int fftSize = 1024) {
        if (audioData.empty()) throw std::runtime_error("No audio data.");
        int N = std::min((int)audioData.size(), fftSize);
        std::vector<double> in(N);
        std::vector<fftw_complex> out(N/2 + 1);
        for (int i = 0; i < N; ++i) in[i] = (double)audioData[i];
        fftw_plan p = fftw_plan_dft_r2c_1d(N, in.data(), out.data(), FFTW_ESTIMATE);
        fftw_execute(p);
        fftw_destroy_plan(p);
        std::vector<double> mags(N/2 + 1);
        double mx = 0;
        for (int i = 0; i < (int)mags.size(); ++i) {
            double re = out[i][0], im = out[i][1];
            double mag = std::sqrt(re*re + im*im);
            mags[i] = mag;
            if (mag > mx) mx = mag;
        }
        if (mx < 1e-9) mx = 1;
        cimg_library::CImg<unsigned char> img(width, height, 1, 3, 0);
        unsigned char color[3] = {0, 255, 0};
        double binsPerPixel = (double)mags.size() / width;
        for (int x = 0; x < width; ++x) {
            int start = (int)(x * binsPerPixel), end = (int)((x+1) * binsPerPixel);
            if (end >= (int)mags.size()) end = (int)mags.size()-1;
            double sum = 0;
            for (int i = start; i <= end; ++i) sum += mags[i];
            double avg = sum / (end - start + 1);
            int h = (int)((avg / mx) * (height - 1));
            for (int y = height - 1; y > height - 1 - h; --y) {
                img(x,y,0) = color[0]; img(x,y,1) = color[1]; img(x,y,2) = color[2];
            }
        }
        img.save(outFilename.c_str());
    }

private:
    std::vector<float> audioData;
    int sampleRate = 0;
};
The Refactoring Journey
To improve maintainability and align with the team's expertise, the decision was made to refactor the C++ codebase into C#. This transformation would leverage the .NET ecosystem while maintaining the core functionality of the audio visualization system.
xFactor with Generated Code
xFactor was employed to transform the C++ codebase into a C# implementation. The refactoring process focused on maintaining the same functionality while leveraging .NET libraries such as NAudio for audio processing and System.Drawing for image generation.
Refactored C# Code
using System;
using System.Collections.Generic;
using System.Drawing;
using System.IO;
using System.Linq;
using NAudio.Wave;
using NAudio.Dsp;

class Program
{
    static void Main()
    {
        string inFile = "C:\\Devis\\Recording.wav"; // Example Path
        if (!File.Exists(inFile))
        {
            Console.WriteLine("Wave file not found!");
            return;
        }

        var audioData = LoadMonoWav(inFile);
        if (audioData.Count == 0)
        {
            Console.WriteLine("No audio loaded or file is not mono.");
            return;
        }

        // Example Output Paths
        SaveWaveformImage(audioData, "C:\\Devis\\waveform.png");
        SaveFftImage(audioData, "C:\\Devis\\fft.png");
        Console.WriteLine("waveform.png and fft.png have been created.");
    }

    static List<float> LoadMonoWav(string filePath)
    {
        var list = new List<float>();
        using (var reader = new AudioFileReader(filePath))
        {
            if (reader.WaveFormat.Channels != 1)
                return list; // Return empty list if not mono

            int sampleRate = reader.WaveFormat.SampleRate;
            float[] buffer = new float[sampleRate]; // Read in chunks
            int read;
            while ((read = reader.Read(buffer, 0, buffer.Length)) > 0)
            {
                list.AddRange(buffer.Take(read));
            }
        }
        return list;
    }

    static void SaveWaveformImage(List<float> data, string outPath, int width = 800, int height = 200)
    {
        if (data == null || data.Count == 0) return; // Check for empty data

        float max = 0f;
        foreach(float val in data) {
            max = Math.Max(max, Math.Abs(val));
        }
        if (max < 1e-9f) max = 1f; // Avoid division by zero

        using (var bmp = new Bitmap(width, height))
        using (var gfx = Graphics.FromImage(bmp)) // Use Graphics for efficiency
        {
            gfx.Clear(Color.Black); // Set background to black
            int midY = height / 2;
            double step = (double)data.Count / width;

            for (int x = 0; x < width; x++)
            {
                int startIndex = (int)(x * step);
                int endIndex = (int)((x + 1) * step);
                if (endIndex >= data.Count) endIndex = data.Count - 1;
                if (startIndex > endIndex) startIndex = endIndex; // Ensure valid range

                double sum = 0;
                int count = 0;
                for (int i = startIndex; i <= endIndex; i++) {
                    sum += data[i];
                    count++;
                }

                double avg = (count > 0) ? sum / count : 0;
                int amp = (int)((avg / max) * (midY - 1)); // Scale amplitude

                // Draw vertical line segment for this x coordinate
                 if (amp >= 0) {
                     gfx.DrawLine(Pens.White, x, midY, x, midY - amp);
                 } else {
                     gfx.DrawLine(Pens.White, x, midY, x, midY - amp);
                 }
            }
            bmp.Save(outPath, System.Drawing.Imaging.ImageFormat.Png); // Specify PNG format
        }
    }

    static void SaveFftImage(List<float> data, string outPath, int fftSize = 1024, int width = 800, int height = 200)
    {
         if (data == null || data.Count == 0) return; // Check for empty data

        // Ensure fftSize is a power of 2
        if ((fftSize & (fftSize - 1)) != 0) {
           // Find the nearest power of 2 (optional, could throw error instead)
            fftSize = (int)Math.Pow(2, Math.Ceiling(Math.Log(fftSize, 2.0)));
        }


        Complex[] fftBuffer = new Complex[fftSize];
        int count = Math.Min(data.Count, fftSize);
        for (int i = 0; i < count; i++)
        {
            // Apply a window function (e.g., Hanning) - Optional but recommended for better FFT results
             double window = 0.5 * (1 - Math.Cos(2 * Math.PI * i / (count - 1)));
             fftBuffer[i] = new Complex { X = (float)(data[i] * window), Y = 0f };
        }
        // Zero-pad if data is shorter than fftSize
        for (int i = count; i < fftSize; i++) {
            fftBuffer[i] = new Complex { X = 0f, Y = 0f };
        }

        int m = (int)Math.Log(fftSize, 2.0);
        FastFourierTransform.FFT(true, m, fftBuffer); // Perform FFT

        int halfSize = fftSize / 2;
        float[] magnitudes = new float[halfSize];
        float maxMag = 0f;
        for (int k = 0; k < halfSize; k++)
        {
            float re = fftBuffer[k].X;
            float im = fftBuffer[k].Y;
            // Calculate magnitude: sqrt(re^2 + im^2)
            float mag = (float)Math.Sqrt(re * re + im * im);
            // Convert to dB scale (optional, often better for visualization)
            // magnitudes[k] = (mag > 1e-9f) ? (float)(20 * Math.Log10(mag)) : -100f; // Use -100 dB for very small values
             magnitudes[k] = mag; // Linear scale
             if (magnitudes[k] > maxMag) maxMag = magnitudes[k];
        }

        // Adjust maxMag if using dB scale (find max dB value)
         // maxMag = magnitudes.Max(); // If using dB
         // float minMag = -100f; // Set floor if using dB

        if (maxMag < 1e-9f) maxMag = 1f; // Avoid division by zero for linear scale

        using (var bmp = new Bitmap(width, height))
        using (var gfx = Graphics.FromImage(bmp))
        {
            gfx.Clear(Color.Black); // Black background
            double binsPerPixel = (double)halfSize / width;

            for (int x = 0; x < width; x++)
            {
                int startBin = (int)(x * binsPerPixel);
                int endBin = (int)((x + 1) * binsPerPixel);
                if (endBin >= halfSize) endBin = halfSize - 1;
                if (startBin > endBin) startBin = endBin;

                double sum = 0;
                int binCount = 0;
                 for (int b = startBin; b <= endBin; b++) {
                     sum += magnitudes[b];
                     binCount++;
                 }
                 double avg = (binCount > 0) ? sum / binCount : 0;

                // Linear scaling
                int barHeight = (int)((avg / maxMag) * (height - 1));
                // // Logarithmic (dB) scaling (adjust range as needed)
                // float dbRange = maxMag - minMag;
                // int barHeight = (dbRange > 0) ? (int)(((avg - minMag) / dbRange) * (height - 1)) : 0;

                barHeight = Math.Max(0, Math.Min(height - 1, barHeight)); // Clamp height

                if (barHeight > 0) {
                    gfx.FillRectangle(Brushes.LimeGreen, x, height - 1 - barHeight, 1, barHeight); // Draw bar from bottom up
                }
            }
            bmp.Save(outPath, System.Drawing.Imaging.ImageFormat.Png); // Save as PNG
        }
    }
}
Audio Sample and Visualizations
Below are three representations of the same audio data processed using the refactored C# code. The original audio sample can be played directly. The waveform visualization, generated by the SaveWaveformImage() method, shows the amplitude of the audio signal (white line) over time against a black background, indicating louder moments with higher peaks. The FFT visualization, created by the SaveFftImage() method, displays the frequency spectrum (green bars) of the audio.
Original Audio
Waveform Visualization

FFT Visualization

Enhanced Code with Comments
After the initial code generation, xFactor's enhance code feature was used to add comprehensive comments. Note that line breaks were added to the main set of comments for improved readability.
Enhanced C# Code with Comments
// This code is a console application that takes an audio waveform from a file,
// processes it, and then saves the processed data in two different image formats:
// "waveform.png" and "fft.png". The main function first checks if the input file
// exists and if so, reads the audio data using the LoadMonoWav() method. This
// method loads mono waveform data from a specified file path and returns it as a
// List of float values.

// If the loaded data is empty or the original file is not mono, an error message
// is displayed and the program exits. Otherwise, the SaveWaveformImage() and
// SaveFftImage() methods are called to save waveform and FFT images, respectively.

// The SaveWaveformImage() method takes a List of float values as input, converts
// it into a grayscale image using an amplitude-to-color mapping, and saves the
// result as a PNG file. The SaveFftImage() method first creates an interleaved
// array for real and imaginary parts of complex numbers that represent FFT
// coefficients, performs FFT on this array using a Fast Fourier Transform
// library, calculates magnitudes for bins [0..(N/2)], and then converts the
// magnitudes into a grayscale image. Both images are saved as PNG files.

using System;
using System.Collections.Generic;
using System.Drawing;
using System.IO;
using System.Linq;
using NAudio.Wave;
using NAudio.Dsp;

// The Program class is responsible for processing mono wav files,
// generating a waveform image and a Fast Fourier Transform (FFT) image.
// It requires a file path to a mono wav file as input and outputs two image files: a waveform image and an FFT image.
class Program
{
    static void Main()
    {
        // Input file path
        string inFile = "C:\\Devis\\Recording.wav"; // Example Path

        // Precondition: The input file must exist.
        if (!File.Exists(inFile))
        {
            Console.WriteLine("Wave file not found!");
            return;
        }

        // Load the mono audio data from the input file
        var audioData = LoadMonoWav(inFile);

        // Precondition: The input file must contain audio data and it must be a mono file.
        if (audioData.Count == 0)
        {
            Console.WriteLine("No audio loaded or file is not mono.");
            return;
        }

        // Generate a waveform image and an FFT image from the loaded audio data
        // Example Output Paths
        SaveWaveformImage(audioData, "C:\\Devis\\waveform.png");
        SaveFftImage(audioData, "C:\\Devis\\fft.png");

        // Output: Two image files (waveform.png and fft.png) have been created.
        Console.WriteLine("waveform.png and fft.png have been created.");
    }

    // The LoadMonoWav method loads mono wav audio data from a file into a List.
    // It requires a file path to a mono wav file as input and returns a List containing the audio data.
    static List<float> LoadMonoWav(string filePath)
    {
        var list = new List<float>();

        // Use AudioFileReader to read the file
        using (var reader = new AudioFileReader(filePath))
        {
            // Precondition: The input file must be a mono file.
            if (reader.WaveFormat.Channels != 1) {
                Console.WriteLine("Warning: Input file is not mono. Cannot process.");
                return list; // Return empty list
            }

            int sampleRate = reader.WaveFormat.SampleRate;
            float[] buffer = new float[sampleRate]; // Process audio in chunks (e.g., 1 second)
            int read;

            // Read the audio data and add it to the list
            while ((read = reader.Read(buffer, 0, buffer.Length)) > 0)
            {
                list.AddRange(buffer.Take(read));
            }
        }
        return list;
    }

    // The SaveWaveformImage method generates a waveform image from audio data and saves it to a file.
    // It requires a List containing the audio data and an output file path as inputs.
    // It optionally takes an image width and height, which default to 800 and 200 respectively.
    static void SaveWaveformImage(List<float> data, string outPath, int width = 800, int height = 200)
    {
        // Input validation
        if (data == null || data.Count == 0) {
             Console.WriteLine("Error: No audio data provided for waveform generation.");
             return;
        }
        if (width <= 0 || height <= 0) {
            Console.WriteLine("Error: Invalid image dimensions for waveform.");
            return;
        }


        // Find the maximum absolute amplitude for normalization
        float max = 0f;
        foreach (float val in data) {
            max = Math.Max(max, Math.Abs(val));
        }
        // Prevent division by zero if audio is silent
        if (max < 1e-9f) max = 1f;

        // Create a new bitmap for the image
        using (var bmp = new Bitmap(width, height))
        // Get Graphics object for drawing
        using (var gfx = Graphics.FromImage(bmp))
        {
            // Clear the image with a black background
            gfx.Clear(Color.Black);
            int midY = height / 2; // Vertical center line
            // Calculate how many samples correspond to one pixel horizontally
            double step = (double)data.Count / width;

            // Iterate through each horizontal pixel
            for (int x = 0; x < width; x++)
            {
                // Determine the range of audio samples for this pixel
                int startIndex = (int)(x * step);
                int endIndex = (int)((x + 1) * step);
                 // Clamp endIndex to the bounds of the data
                if (endIndex >= data.Count) endIndex = data.Count - 1;
                 // Ensure startIndex is not greater than endIndex
                 if (startIndex > endIndex) startIndex = endIndex;

                // Calculate the average amplitude within this sample range
                double sum = 0;
                int count = 0;
                for (int i = startIndex; i <= endIndex; i++) {
                    sum += data[i];
                    count++;
                }
                double avg = (count > 0) ? sum / count : 0; // Avoid division by zero

                // Scale the average amplitude to the image height
                // (midY - 1) prevents drawing exactly at the top/bottom edge
                int amp = (int)((avg / max) * (midY - 1));

                // Draw a vertical line representing the amplitude at this pixel
                // Use Pens.White for a white line
                gfx.DrawLine(Pens.White, x, midY, x, midY - amp);
            }

            // Save the bitmap to the specified output path as a PNG image
            try {
                bmp.Save(outPath, System.Drawing.Imaging.ImageFormat.Png);
            } catch (Exception ex) {
                Console.WriteLine($"Error saving waveform image: {ex.Message}");
            }
        }
    }

    // The SaveFftImage method generates an FFT (spectrogram-like) image from audio data and saves it to a file.
    // It requires a List containing the audio data and an output file path as inputs.
    // It optionally takes an FFT size, image width, and image height, which default to 1024, 800, and 200 respectively.
    static void SaveFftImage(List<float> data, string outPath, int fftSize = 1024, int width = 800, int height = 200)
    {
         // Input validation
        if (data == null || data.Count == 0) {
             Console.WriteLine("Error: No audio data provided for FFT generation.");
             return;
        }
         if (width <= 0 || height <= 0) {
            Console.WriteLine("Error: Invalid image dimensions for FFT.");
            return;
        }
        // FFT size must be a power of 2 for the NAudio FFT implementation
        if ((fftSize & (fftSize - 1)) != 0 || fftSize <= 0) {
            Console.WriteLine("Error: fftSize must be a positive power of 2.");
             // Optionally, find the nearest power of 2 or return
             // fftSize = (int)Math.Pow(2, Math.Ceiling(Math.Log(fftSize, 2.0)));
             return;
        }

        // Prepare buffer for FFT. This takes the first fftSize samples (or fewer if data is shorter).
        Complex[] fftBuffer = new Complex[fftSize];
        int count = Math.Min(data.Count, fftSize); // Number of samples to process

        // Copy data to FFT buffer and apply a window function (Hanning window)
        // Windowing reduces spectral leakage artefacts.
        for (int i = 0; i < count; i++)
        {
            double window = 0.5 * (1 - Math.Cos(2 * Math.PI * i / (count - 1))); // Hanning window
            fftBuffer[i] = new Complex { X = (float)(data[i] * window), Y = 0f }; // Apply window to real part, imaginary part is 0
        }
        // Zero-pad the rest of the buffer if the audio data is shorter than fftSize
        for (int i = count; i < fftSize; i++) {
            fftBuffer[i] = new Complex { X = 0f, Y = 0f };
        }

        // Perform the Fast Fourier Transform
        // 'm' is log2(fftSize)
        int m = (int)Math.Log(fftSize, 2.0);
        FastFourierTransform.FFT(true, m, fftBuffer); // true for forward FFT

        // Calculate magnitudes from the complex FFT results
        // We only need the first half of the results (0 to N/2) due to symmetry
        int halfSize = fftSize / 2;
        float[] magnitudes = new float[halfSize];
        float maxMag = 0f; // To store the maximum magnitude found (for normalization)
        for (int k = 0; k < halfSize; k++)
        {
            float re = fftBuffer[k].X; // Real part
            float im = fftBuffer[k].Y; // Imaginary part
            // Magnitude = sqrt(real^2 + imaginary^2)
            float mag = (float)Math.Sqrt(re * re + im * im);
            magnitudes[k] = mag;
            // Keep track of the maximum magnitude for scaling the image later
            if (mag > maxMag) maxMag = mag;
        }

        // Avoid division by zero if the result is silent
        if (maxMag < 1e-9f) maxMag = 1f;

        // Draw the magnitudes onto a bitmap image
        using (var bmp = new Bitmap(width, height))
        using (var gfx = Graphics.FromImage(bmp))
        {
             // Clear the image with a black background
            gfx.Clear(Color.Black);
            // Calculate how many FFT bins correspond to one horizontal pixel
            double binsPerPixel = (double)halfSize / width;

             // Iterate through each horizontal pixel of the image
            for (int x = 0; x < width; x++)
            {
                // Determine the range of FFT bins for this pixel
                int startBin = (int)(x * binsPerPixel);
                int endBin = (int)((x + 1) * binsPerPixel);
                // Clamp bin indices to valid range
                if (endBin >= halfSize) endBin = halfSize - 1;
                if (startBin > endBin) startBin = endBin;


                // Calculate the average magnitude within this bin range
                double sum = 0;
                int binCount = 0;
                 for (int b = startBin; b <= endBin; b++) {
                     sum += magnitudes[b];
                     binCount++;
                 }
                double avg = (binCount > 0) ? sum / binCount : 0;

                // Scale the average magnitude to the image height (linear scaling)
                int barHeight = (int)((avg / maxMag) * (height - 1));
                 // Ensure barHeight is within image bounds
                barHeight = Math.Max(0, Math.Min(height - 1, barHeight));

                // Draw a vertical bar (1 pixel wide) for this frequency range
                // Use LimeGreen color
                if (barHeight > 0) {
                    // FillRectangle is slightly faster for single pixels or thin lines
                    gfx.FillRectangle(Brushes.LimeGreen, x, height - 1 - barHeight, 1, barHeight);
                }
            }

            // Save the resulting bitmap as a PNG file
             try {
                bmp.Save(outPath, System.Drawing.Imaging.ImageFormat.Png);
             } catch (Exception ex) {
                 Console.WriteLine($"Error saving FFT image: {ex.Message}");
             }
        }
    }
}
Security Evaluation
Following the code generation, xFactor performed both a standard security assessment and a MITRE ATT&CK framework analysis of the refactored code, identifying potential risks and suggesting improvements.
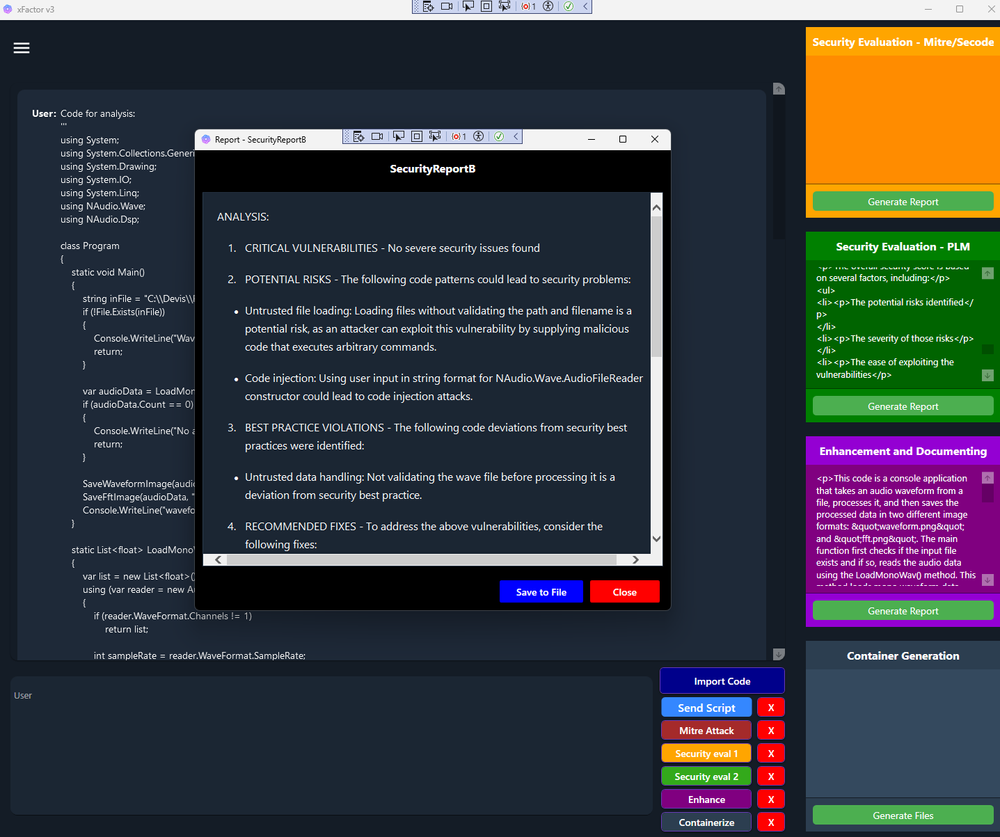
Standard Security Analysis Results
ANALYSIS:

CRITICAL VULNERABILITIES - No severe security issues found

POTENTIAL RISKS
- Untrusted file loading: Loading files without validating the path and filename (Mitigation needed if paths come from user input)
- Code injection: Not directly applicable here as NAudio handles parsing, but path manipulation is a risk if input is untrusted.

BEST PRACTICE VIOLATIONS
- Untrusted data handling: Not validating the wave file content beyond basic format checks (Potential for malformed files causing issues). Error handling on file operations could be more robust.

RECOMMENDED FIXES
- Validate file paths and filenames rigorously if they originate from external sources.
- Use appropriate allow-listing for input/output directories.
- Implement robust try-catch blocks around file I/O and NAudio operations.
- Consider adding checks for reasonable file sizes or audio lengths.

SECURITY SCORE - 4/10 (Assumes file paths are hardcoded or from trusted sources; score would be lower if paths are user-controlled without validation)
MITRE ATT&CK Analysis Results
ANALYSIS:

IDENTIFIED TACTICS
- RECONNAISSANCE (T1592 - Gather Victim Host Information)

POTENTIAL RISKS
- The code processes local audio files (`C:\Devis\Recording.wav`). If this path were dynamic or user-influenced without proper validation, an attacker could potentially trick the application into accessing unintended audio files on the system, gathering information (e.g., listening for sensitive conversations if microphone recordings are processed).
- Saving output images (`waveform.png`, `fft.png`) to a fixed path (`C:\Devis\`) could potentially overwrite existing files if not handled carefully, which might be leveraged in specific scenarios (though less likely for direct attack).

RELEVANT CODE SECTIONS
- `string inFile = "C:\\Devis\\Recording.wav";` (Potential input point)
- `LoadMonoWav(inFile)` (File access)
- `SaveWaveformImage(audioData, "C:\\Devis\\waveform.png");` (File output)
- `SaveFftImage(audioData, "C:\\Devis\\fft.png");` (File output)

RECOMMENDED MITIGATIONS
- **Input Validation (TA0001 - Initial Access):** If file paths become dynamic, strictly validate inputs. Use allow-lists for directories and file types. Canonicalize paths to prevent directory traversal (`../../`).
- **Least Privilege (TA0005 - Defense Evasion):** Run the application with the minimum necessary permissions to read input audio files and write output images to designated, restricted locations.
- **Error Handling:** Implement robust error handling for file operations to avoid information disclosure through error messages.
- **Auditing:** Log file access attempts, especially failures, which might indicate malicious activity.

ADDITIONAL TACTICS
- No other MITRE ATT&CK tactics directly identified based *solely* on this snippet. However, if this tool were part of a larger system, vulnerabilities could potentially be chained for other tactics like Execution or Impact.

NOTE: This analysis focuses on how the *functionality* could be potentially misused within the ATT&CK framework, assuming an attacker might try to manipulate the file paths or leverage the tool's file access capabilities. The primary risk identified relates to information gathering (Reconnaissance) via unintended file access if input handling is weak.
Conclusion
The xFactor refactoring project successfully transformed a complex C++ audio visualization system into a more maintainable C# implementation. This migration not only preserved the core functionality of generating waveform and FFT visualizations but also aligned the codebase with the team's technical expertise. The security assessment provided valuable insights for further improvements, ensuring the system's robustness and security in its new form.